princessnorah@lemmy.blahaj.zone
on 23 Sep 15:30
collapse
I mean, it says the source right there, it’s the CDC…
themeatbridge@lemmy.world
on 23 Sep 15:38
nextcollapse
The organization run by a brain worm driving a human suit?
princessnorah@lemmy.blahaj.zone
on 23 Sep 15:42
nextcollapse
I don’t understand why you or the person I’m replying to are for some reason seeming to dispute the higher rate of autism diagnosis? It’s a fairly well-established fact, the point of contention is why the rate is higher.
themeatbridge@lemmy.world
on 23 Sep 15:55
nextcollapse
Because that’snot what the graph claims, and it is definitely not what the graph implies.
The graph says that there has been a 400% increase in the prevalence of autism. That’s not true, and is unsupported by the evidence. There has been a marked increase in the effective diagnosis and therapeutic interventions, but autism was largely undiagnosed and under-reported for almost all of human history. We’re still improving and refining the diagnostic criteria, and any changes in the number of cases should not be suggested to support any causal relationship with anything.
The graph is a lie, intended to push a political narrative that undermines the credibility of actual science, all in a transparent effort to distract from powerful child rapists raping children.
The rate is higher because we can “catch” more cases with better diagnosis.
Imagine machine that is throwing 100 balls per second.
Another machine that can catch 10 balls per second. You catch 10 balls.
Now newer machine can catch 20, and newer can catch 50.
Does that mean the number of thrown balls is higher? No. It just means we have machines better at caching them. The same goes for any illness, autism, schizophrenia, cancer, depression…
Some ilnesses we are better at curing, does that mean the the illness is getting weaker?
princessnorah@lemmy.blahaj.zone
on 23 Sep 16:24
collapse
I’m aware of that. I guess my point was that the data isn’t inaccurate, but I suppose* labelling it as “prevalence” is the point of contention.
renzhexiangjiao@piefed.blahaj.zone
on 23 Sep 17:53
collapse
I guess it could be more accurately labeled as “observed prevalence”, which is distinct from the actual prevalence
HylicManoeuvre@mander.xyz
on 26 Sep 08:14
collapse
Yeah, after deleting any data the CDC used to have that they didn’t agree with. And making up any new data they need to make their preconceived notion as perceivably supported as possible.
In this case no. It’s the fact that we’re better at diagnosing things, any disease that doesn’t have active treatments is going to be similar.
You could do reports of ED over time and that graph is going to skyrocket not because it’s more or less common but rather more people are willing to get diagnosed to seek remediation. Right around the discovery of Viagra and it’s ilk you’d see skyrocketing ED diagnoses and it’s not like dicks just suddenly stopped working.
Tarquinn2049@lemmy.world
on 23 Sep 19:28
nextcollapse
I just mean listing the source as “the CDC” currently isn’t disproving that it’s made up anymore.
It may be accurate, but not because it is from the CDC anymore.
piranhaconda@mander.xyz
on 23 Sep 19:46
nextcollapse
Thought you meant Eating Disorders til the Viagra comment. Had to reread the whole thing
Also, more kids are just getting diagnosed. Back when I was in school in the 90s, I was very lucky to be in a rich school district that actually taught teachers how to spot signs so they could recommend a screening, which the district would foot the bill for because they had a psychologist on staff. Now, more and more districts have people like that, and more and more teachers are taught how to spot early signs of autism (and more parents are aware of it) that kids who previously might have just been “weird kids” are actually getting diagnosed with autism.
I won’t deny a potential environmental link, but if there is one, it’s likely more linked to fossil fuels than anything. BUT that’s hard to get traction against, and it doesn’t have a magic bullet that’ll immediately “solve” the issue.
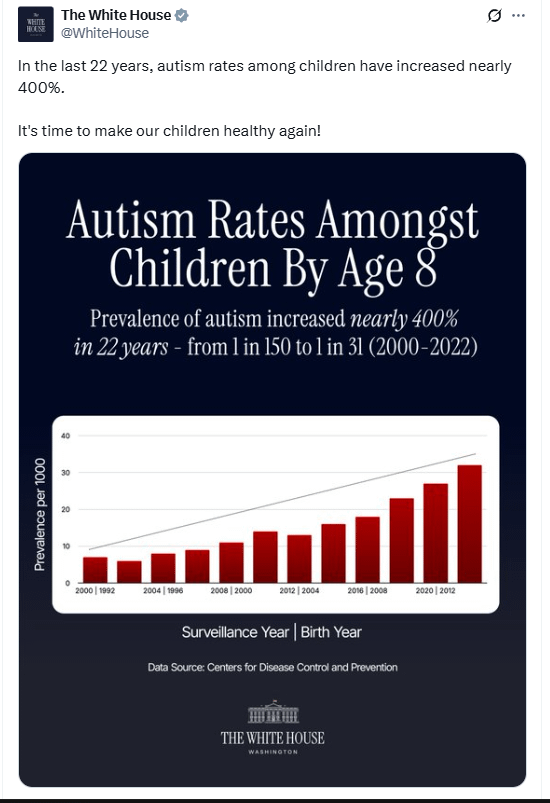
Can somebody smarter than me tell me what this is trying to say? There’s a bar for surveillance year and birth year. But, for instance, 2012 is on the graph twice with different values. What does it mean?
Edit:
I think I got it. The graph is of “Autism rates in 8 year olds over time”. And the X axis should just be year (in 2 year increments).
fossilesque@mander.xyz
on 23 Sep 15:33
nextcollapse
It’s no longer number go up good season.
bleistift2@sopuli.xyz
on 23 Sep 15:36
nextcollapse
2012 appears once as a birth year and once as a surveillance year. The graph says that they only ever surveyed 8-year-olds, since the birth year is always 8 less than the surveillance year.
Bad graph, they couldn’t decide if the X axis was the birth year of the kids or the year of the test but they give the same information since it’s always 8-year-old kids being tested. Anyways, they wrote the year of the test first and second the year of birth.
Bad Graph says: 0.75% of 8 year olds were diagnosed in 2000 versus 3.2% in 2020.
Correlation =/= causation.
How have the diagnostic criteria changed in 20 years?
Autism was a stigma when I was in high school in 2000, now it’s a spectrum.
Are there routine screenings at pediatricians now?
I tutored a young autistic man in college and he was almost non-verbal. He could communicate through speech, but only in monosyllables and with great difficulty and stuttering. That was the only definition of autism I understood at that time, and he was considered better off than many.
A few years later when I learned about Asperger’s because my sister got diagnosed with it, I went to get evaluated myself and after sitting down with me once, they said I’m not autistic.
I’m about 99% sure I would be placed on the autism spectrum today.
I don’t know whether it’s good or bad that the diagnostics / definition of autism seem to be broadening — that’s above my pay grade. But you can’t deny people who weren’t considered autistic 30 years ago are today, and so to compare autism rates which measure clearly different levels of capability is pretty useless.
In order to compare rates, we would need a consistent set of diagnostic criteria.
Kolonel_Kahlua@lemmy.world
on 23 Sep 18:55
collapse
Same guys that tarrifed an island full of penguins?
Each bar shows two years; years they surveyed the kids and the year the kids were born.
So 2000|1992, is saying that kids born in 1992 were surveyed in 2000. If you look at tmit with thtmat perspective you can see it’s ordered by the year.
Flaqueman@sh.itjust.works
on 23 Sep 15:35
nextcollapse
Number of unvaxxed kids also growing in the past 22 years. I think it proves that autism is caused by lack of vaccine.
ChaoticNeutralCzech@feddit.org
on 23 Sep 15:45
nextcollapse
There is an 𝑥 axis and it’s not too hard to comprehend, although I’d prefer the dividing character to be newline rather than “|”, or only show the surveillance year.
Also, the “trendline” is sus, an actual trendline cannot always be above data.
I honestly don’t know why they even list the birth year. It explicitly states “8 Year Olds”, we can do the math.
BananaTrifleViolin@lemmy.world
on 23 Sep 16:09
nextcollapse
Yeah Autism rates are going up in all groups because people are getting diagnoses. This is partly about better awareness but also partly about money - there is an incentive to expand the diagnosis, diagnose more people and treat more people, which somewhat muddies the water. Autistic Spectrum Disorder first appeared in the American DSM in 2012, unifying 5 existing conditions into one, and then it moved into the international ICD in 2018 (going live in 2022). It is no wonder awareness has gone up, and infrastructure for diagnosis has rolled out.
We’re not seeing an increase in Autism, we’re seeing an increase in the diagnosis of autism. This graph just shows how stupid and dumbed down the CDC and the White House is under this cretinous president.
Windex007@lemmy.world
on 23 Sep 16:45
nextcollapse
It’s probably more than just better diagnosis.
“Advanced Parental Age” has a significant body of work behind it, and people are having kids quite a bit older than they used to, because… you know… gestures broadly at how fucked up the world is
Statistical distributions suck, especially when we want a clear-cut cause-and-effect silver bullet. My only sister has two autistic sons, and my wife and I were 7 years older than she was when we had our son and he isn’t autistic (as far as we can tell thus far).
As a brother and uncle, I have incredible empathy for the desire and frustration to just get a clear answer on this. And I recognize these feeling however intense are orders of magnitude less than for a parent. It’s not like lead or asbestos or thaledimide or radiation.
Best we’ve got is a confluence of factors, not the least being family history knowing full well how bad diagnosis has been historically.
It’s so incredibly predatory to dump the science in the trash and just say “it was Tylenol all along”.
we’re seeing an increase in the diagnosis of autism.
Absolutely.
We’re not seeing an increase in Autism
Not sure about that. It can be both.
AnarchistArtificer@slrpnk.net
on 24 Sep 03:44
collapse
Sure, it’s possible, but I’m not sure there’s data to support the idea of increasing rates of autism. The increase in diagnosis rates is way too strong of a confounder
DarkCloud@lemmy.world
on 23 Sep 16:22
nextcollapse
Just as the microplastics are getting into everything!
A nice dose of synthetic hormones!
Caffeinated_Sloth@lemmy.world
on 23 Sep 16:22
nextcollapse
Military spending also increased from 2000-2022, ergo military spending causes autism.
lugal@lemmy.dbzer0.com
on 23 Sep 16:28
nextcollapse
I think the x axis is “year of measurement | year of birth” since they are 8 years apart. Very unconventional and it would need an explanation but it’s not bad to have both pieces of information handy in this context
reallykindasorta@slrpnk.net
on 23 Sep 16:40
nextcollapse
interdimensionalmeme@lemmy.ml
on 23 Sep 19:42
collapse
In hypernormalization, making SURE you know they ARE LYING and that IT DOESN’T MATTER is essential.
Because the goal is to make you believe you can’t do anything, so that you give up and demobilize that is their goal.
Very well said. I will make a concerted effort to inject “hypernormalization” into my speech more often going forward. For decades I’ve been saying to friends that the reductionist obsession with “normal” (whatever the hell that means) is a cancer to modern society.
In particular it already sounds creepy when you replace usage with its verb-form, e.g. changing “all my friends are normal” to “all my friends have been normalized”. It’s common practise to use a re-encoder to normalize a “background” playlist of songs to the same dB threshold so no single song sticks out and distracts us from what we are trying to focus on while listening. Similarly, authorities of an authoritarian ilk try to normalize populations so none of them stick out and distract from the primary focus (centralization of power and money). Hypernormalization involves taking that to its logical conclusion, telling the vast majority of people “stay in your lane” - meaning “shut up and consume, and when we tell you what to buy you buy it”, AKA be “normal(ized)”).
interdimensionalmeme@lemmy.ml
on 25 Sep 20:07
collapse
The authorities want an homogeneous population, as they also have a limited ability to imagine the social sphere in multiple dimensions, this is why you’re seeing things like the gender binaries. At least that’s just two simulations to run. But gender as spectrum, this becomes quickly untenable for the elites to model for control, they wish the squash the real world complexity into flattened binaries or even uniformity.
Yes, I think you got it exactly right and the audio normalization analogy is correct, at least for sound nerds like us.
Hypernormalization is a dysfunctional response from elites due to their human cognitive weakness. This is why we’re not going back to “King” no single human can bear the complexity of the entire world in their skull mush. They will melt down and genocide the Kurds when it gets too hard for them to conjugate everything. This is why dictators and fascism will do a lot of damage, but have no hope whatsoever for success. They are “rebellion from cognitive weakness”, they violently lash out at complexity itself, at those things they cannot understand. They want to reduce everything to a simple narrative of us versus them and then destroy “them” so only a uniform homogeneous “us” remains. This “us” identical to the ruler, does not require the ruler to imagine “the other” instead they only rule as if everyone else was an identical copy of them. And if anyone disagrees with that, they are “other”.
From that we know the “few” cannot rule the many, but then how do we avoid the traps of design by committee, bikeshedding and the various paralysis that come from complexity beyond human cognition. Concentrations of power are too dumb to rule, but the mob and the market are also dumb and easily fooled, not to mention irresponsible and self-destructive. (The market is burning the planet, right now, it cannot see into the future). The mob is emotional and easily manipulated, often by its own emotions.
I think we need new modes of thinking more advanced than what we had in the 1700s. Something invented with at least the idea of what a computer could do.
You’ll probably want to watch the best documentary on the subject
neukenindekeuken@sh.itjust.works
on 23 Sep 19:34
nextcollapse
That’s like saying we have more cancer now than in the past.
Sure, that might be true in certain scenarios (we’re very good at creating new ways to give ourselves cancer).
The truth is that we’re living longer, increasing the risk and likelihood of cancer, and we’ve gotten a LOT better at finding and diagnosing cancer and specific types.
thejml@sh.itjust.works
on 23 Sep 19:41
nextcollapse
“8 year olds, dude.” - Walter Sobchak
homesweethomeMrL@lemmy.world
on 23 Sep 21:54
collapse
In my country there has been a huge increase in both ADHD and autism diagnoses the last decades. At the same time in those years the methods to discover both diagnoses have improved greatly.
But you know, correlation does not equal causation..
slaneesh_is_right@lemmy.org
on 23 Sep 20:50
nextcollapse
30 years ago my teacher suspected i am on som sort of spectrum and had to get tested. I remember going to some doctor and i had to clap really fast and look into a light. Believe it of not i was not diagnosed with ADHD, because i’m a really good clapper
Damn! You should get vaccinated for whatever and try again. Better luck next time?
mic_check_one_two@lemmy.dbzer0.com
on 23 Sep 21:40
nextcollapse
Yeah, this is like saying “skin cancer rates have increased dramatically in the past 30 years!” Well yeah, because now we have the technology to detect it earlier. That “things increased” stat ignores the complementary “but deaths decreased dramatically” stat that immediately follows it. Before, we didn’t know people had skin cancer until it was killing them. But now, with preventative screenings, public awareness campaigns, etc, people are more likely to get checked before it is a life threatening issue.
It’s the same thing. Detection models got better, so detection rates went up.
manuallybreathing@lemmy.ml
on 24 Sep 00:42
collapse
Mandating helmets for the boys at the front is resulting in many more head injuries!
iAvicenna@lemmy.world
on 23 Sep 20:44
nextcollapse
prevalence of cancer has increased ∞% since 0 BC
homesweethomeMrL@lemmy.world
on 23 Sep 21:54
collapse
I’m not saying the graph is the best graph ever, I’m saying it’s far from the worst I’ve seen.
Its also clearly not a line of best fit, as it isn’t trying to “fit” the data. It’s a trend line that’s a vertically offset line from lowest to highest. It’s a stupid line, but being used to convey how much growth their has been.
The only real issue with this graph is the information/context being ommited. We know there is a lot more to the autism debate beyond just the rate of diagnosis.
Pandantic@midwest.social
on 24 Sep 02:14
nextcollapse
It looks nepotism put a failson in charge of this graph.
When they collected the data in 2000, about seven 8 year olds out of 1000 had autism. Those children were born in 1992.
When they collected the data in 2002, about six 8 year olds out of 1000 had autism. Those children were born in 1994. This information was not labelled on the x axis.
When they collected the data in 2004, about eight 8 year olds out of 1000 had autism. Those children were born in 1996.
When they collected the data in 2006, about nine 8 year olds out of 1000 had autism. Those children were born in 1998. This information was not labelled on the x axis.
When they collected the data in 2008, about eleven 8 year olds out of 1000 had autism. Those children were born in 2000.
… I’m too lazy to continue but …
When they collected the data in 2020, about twenty seven 8 year olds out of 1000 had autism. Those children were born in 2012.
When they collected the data in 2022, about thirty two 8 year olds out of 1000 had autism. Those children were born in 2014. This information was not labelled on the x axis.
I’m not positive i’m reading it right, but that’s what I think they were trying to convey with this (terribly labeled) graph.
eta: yeah, rereading the subtitle, those numbers and years make sense
GlendatheGayWitch@lemmy.world
on 24 Sep 14:32
collapse
Any clue why there are 2 bars per year grouping?
I thought it was maybe number of cases in each year, but 2000 at the beginning of the graph and when 2000 appears later don’t match.
I think there’s actually not 2 bars per year, but instead:
the first red bar = the year 2000
the second bar (which is not paired with another bar, and also, is not labelled at all) = the year 2002
the third bar = the year 2004
the fourth bar = the year 2006
and so on until the final bar, the twelfth one, = the year 2022
The x axis increases by 2 years each entry.
The number after the “|” is only meant to “helpfully” (and confusingly) tell you when those children were born. To take your example:
the data for the year 2000 is represented by the first red bar (7 per 1000 eight year olds had autism in 2000) and is labelled as 2000 | 1992 because those kids were born in 1992.
the data for the year 2008 is represented by the fifth red bar (11 per 1000 eight year olds had autism in 2008) and is labelled as 2008 | 2000 because those kids were born in 2000.
GlendatheGayWitch@lemmy.world
on 24 Sep 22:45
collapse
That makes sense now! Thank you, I was having trouble wrapping my head around it!
kadaverin0@lemmy.dbzer0.com
on 24 Sep 23:19
collapse
The line went up which usually good. The very best. We have the best lines in this great country. But Bobby said this isn’t a good line so I said, I told them, we need to find out why the line is bad. And I’ve got people on it who say don’t take Tylenol. So that’s all that needs to be said. Don’t. Take. Tylenol.
aeternum@lemmy.blahaj.zone
on 24 Sep 02:54
nextcollapse
you know, everest was still there before it was discovered.
If they could read or do comparisonal analysis or could formulate higher-functional abstraction in their frontal lobes, this would really make them think.
militaryintelligence@lemmy.world
on 24 Sep 04:49
nextcollapse
Autism is a spectrum., same as gender ideology. Whether you like it or not, it’s true.
We’re better at diagnosis
Preconceived notions about such things aren’t as prevalent, until recently for political reasons
ZILtoid1991@lemmy.world
on 24 Sep 06:18
nextcollapse
They’re basically banking on people still thinking, autism is “intellectual disability, but quirkier and more difficult”, while I have met “more severe” cases who did not had the ID part, they just were lucky to avoid the diagnosis for long, and thus people didn’t pretend they’re “too dumb to even learn to count to 10”.
I’m a woman in my 40s who is probably autistic, but back then I was the wrong demographic and “too well behaved” to even consider diagnosis. I’m a typical example people think of when thinking about under diagnosis.
On the other hand, I work with people who have severe learning disabilities who also evaded diagnosis, or were diagnosed well into adulthood as diagnosis is difficult in someone so impaired. In another time, they would have been labelled with a grossly offensive term and just left. Better treatment of disabled people is probably another reason we see rising rates of diagnosis.
Our species broadly doesn’t think in terms of spectrums or nuance.
I burned years of my life trying to make arguments from reason and explain how there can be simultaneous truths or that issues are not black-and-white. It has NEVER stuck, not with friends, not with family, not with strangers on the internet.
People’s minds largely do not work that way. We all HAVE to digest this and mourn it and let it pass through us so we can stop trying to argue with these blockheads in ways they can’t even grasp. We can change them if we tell them stories about feelings, if we make them feel validated or heard, we can change them with careful, patient one-on-one care like a parent telling a child bedtime stories… but this takes a level of energy, empathy and patience that few of us have. Some do, I give massive respect to those who have dedicated their lives to this kind of outreach. I wish we had more.
brucethemoose@lemmy.world
on 24 Sep 22:59
collapse
This is precisely what ‘leader scientists’ did when folks in power plopped them before crowds and radio and TV and such for a long time.
…It kinda worked.
But we’re in the algorithmic attention era now. We are past that era.
ComradeRachel@lemmy.blahaj.zone
on 24 Sep 05:01
nextcollapse
10 out of a 1000 to 30ish out of a 1000 doesn’t even seem like a massive increase, especially if it’s really due to something like a pain medication that is taken by a huge population. Which it’s not as it’s more related to improvements in diagnosing.
I guess they are just hoping people see bar go up and therefore bad.
I think it’s just the number of diagnoses made in that particular year. But it doesn’t matter because we know this graph is made up anyway. It’s a Trump administration putting it out, I bet not one of them knows how to get excel to output a bar chart, so instead it’s just random rectangles they’ve drawn.
atcorebcor@sh.itjust.works
on 25 Sep 09:36
collapse
I mean there is scientifically a rise in autism diagnoses, but it’s like explained by awareness and decreased criteria to qualify as being on the spectrum - not by an increase in actual autism.
ArchmageAzor@lemmy.world
on 24 Sep 08:44
nextcollapse
Guarantee you the people afraid of autism has no idea what it even is, other than “bad”
There’s a vast number of conservative parents who have said they would support abortion in cases of fetal abnormalities like “autism” because they’re not pro-life or informed about anything, they’re just scared. They’re scared of hardships, they’re scared of emotional labor, they’re scared of the social stigmas around having to care for someone with special needs, they’re scared they won’t love a child who isn’t normal, and will be judged for it.
They don’t think in logical, reasonable systems, they imagine stories. The entire conservative mindset is narratives and feelings. That’s why things like vaccines and tylenol go so hard for them, it’s an easy McGuffin to comprehend and work into their mental storylines.
kazerniel@lemmy.world
on 24 Sep 09:34
nextcollapse
The axis makes sense with the label, they just didn’t label every data point.
A_Chilean_Cyborg@feddit.cl
on 24 Sep 10:17
nextcollapse
Not autism rates, detection rates is what’s up, more kids are growing up with adequate helps and therapies so they can grow to be functional adults.
hunnybubny@discuss.tchncs.de
on 24 Sep 11:49
nextcollapse
It is the same story as gay infecting children’s minds.
They are selling awareness as something to be afraid of. Which is yet another layer od evil.
A_Chilean_Cyborg@feddit.cl
on 24 Sep 13:41
collapse
Not only that, but they wish really hard for us to be their tiny little scapegoats, when probably most of the autistic community hates them.
JamesBoeing737MAX@sopuli.xyz
on 24 Sep 12:48
nextcollapse
Adequate helps and terapies - repression and psychological abuse. Great. We are functional adults, fuck you.
A_Chilean_Cyborg@feddit.cl
on 24 Sep 13:40
collapse
Uuuhhhhhh, I’m an autistic adult who can somehow function because I had heaps of help growing up, many of my friends weren’t that lucky and have a hard time just existing.
JamesBoeing737MAX@sopuli.xyz
on 24 Sep 18:37
collapse
Fair point, sorry. My statement about not torturing children still stands.
A_Chilean_Cyborg@feddit.cl
on 24 Sep 18:54
collapse
Not all therapies are ABA, most are based in science and helps the kid instead of scarring him, when i was little I actually looked forward to some of them like neurofeedback.
Too add to that there are more types of autism. It’s a spectrum.
A_Chilean_Cyborg@feddit.cl
on 24 Sep 13:39
collapse
Yes, trains autism, boats autism, Math autism… /j
No but for real, no two autistic individuals are ever the same.
Itdidnttrickledown@lemmy.world
on 24 Sep 10:41
nextcollapse
Diagnosis has improved and perhaps been used too soon in some cases. Its always been here but environmental changes of some kind have increased it slightly. Most likely medical culprit is NSAIDs. Not trumps scapegoat of the moment. The other brand was however shown to cause people to lose empathy with sustained use in some studies.
brucethemoose@lemmy.world
on 24 Sep 22:56
collapse
Oh, they will. But reliable data?
Be careful what you wish for, lol.
ThermonuclearCactus@lemmy.blahaj.zone
on 24 Sep 14:00
nextcollapse
In other news, visibility bias has been classified as communist propaganda. Anyone who says this isn’t representative of an actual increase in the incidence rate is a communist and can safely be ignored.
For some reason, that doesn’t look like a GPT-generated graph, which means… sadly… that someone had to make that thing… and somebody had to approve it.
They also could have just grabbed any graph off of google images and relabeled it. That was a apparently a popular shortcut in corporations when someone had to present to their bosses.
OK there are not 2 bars per year. 2nd last is 2020, last 2022.
It’s not clear why everyone is mad at the chart. It does show an increase. Though, this is about autism diagnoseses, which can be influenced by kickback bribes for diagnoseses.
There is a sharper (exponential) increase since 2012, even though pharma corruption solutions existed many years before then, afaik. Some explanation for the acceleration is needed. Its not tylenol or any new vaccines.
pyr0ball@lemmy.dbzer0.com
on 24 Sep 17:12
nextcollapse
My diagnosis is in that spike. I got diagnosed late because it took that long to get away from my autism denying parent and enough time living on my own to start wondering about my “weird habits”, especially after starting to meet others “like me”.
It stopped being a disability in my mind and started being more like a superpower, and eventually out was just who I was and y’all can just deal with it. Of course I leaned boundaries and social graces because we live in a society, but how I view myself and other people definitely changed
So I think it has a lot to do with how this generation and previous ones changed how they handle autism.
Autism diagnosis is can also be increased by just better recognition of the disease. You think anyone was going around giving out autism diagnosis in the 90s come on.
An increase in diagnosis rates does not indicate an underlying increase in the condition.
davidagain@lemmy.world
on 24 Sep 18:48
nextcollapse
Er, did you look at all the dates on the x axis? Because that shit makes no sense whatsoever.
It took me a while to understand the graph too. All of the information needed is included in OP image. Posting what may be Trump/RFK propaganda that may or not be based on lies and non data, just to attack it for not being the absolute clearest graph is posting Trump propaganda. Graph would be clearer if they omitted birth years. OK.
Posting this is still equivalent to “sun goes up sun goes down. ain’t nobody understand that” manipulation that reinforces people’s lack of understanding to trust the speaker on anything and everything.
That line of best fit doesn’t even match the data. How can it start above the data and then finish above the data but still be line of best fit. Not that that’s the only problem with this graph of course.
Instances of autism have skyrocketed since the discovery of autism and effective testing for it.
Clearly these tests are causing the autism. It’s a conspiracy by Big Autist to make the world a quieter and more curious place. The railway companies are in on it too.
Corkyskog@sh.itjust.works
on 25 Sep 01:56
nextcollapse
I think you just predicted the next South Park plot.
Robert F. Kennedy Jr. reveals that Tylenol causes autism, he then wants to open a bottle of it, but fails miserably. Then Eric Cartman gets on the stage talking about the evils of autism, then he shows he was bitten by an autistic girl he “played with”, but the security footage he shows about the meltdown reveals he terribly bullied her, so people will immediately feel sorry for the girl instead.
Kyle manages to open a bottle of Tylenol, not knowing it summons cenobite-like autists from a different dimension, supposedly turning the people who summon them into autists. The others, save for Cartman, manage to find the same autistic girl bullied by Cartman who can also open that bottle summoning the other-worldly autists, who then be convinced by the boys to take them to the autism-world. Said autism-world is mainly designed around the needs of autistic people. After some shenanigans, there comes the reveal that Kyle was always autistic, the autism-cenobites don’t turn anyone into autists as Tylenol bottles can only be opened by other autists, he just was very good at masking, wants to go back to his own world even if there would be people who will bully him for what he is.
Meanwhile, Cartman goes on an “Autism Awareness Tour” to “promote remedies”, but tanks them the moment he shows the footage.
Autism tests cause autism, got it, let’s roll boys, we have more science to ban
devolution@lemmy.world
on 24 Sep 23:42
nextcollapse
Assuming the data is true (doubt it because of fucking beef jerky man), it’s not so much that autism is on the rise so much that autism rates are being diagnosed more and autism is less stigmatized than it was previously.
Imagine the sexist fascist racist homophobe convicted Cheeto puff is also ablest, please keep adding adjectives that describe the 47th president of the Confederated States
If I remember correctly, it fits the same overall curve of the number of reported left handed people over time after society stopped forcibly making people use their right hand. Shockingly, actually making an attempt at diagnosing people and tracking those diagnoses makes numbers go up.
Yes. This is an artifact of a destigmatization coupled with better diagnostics for evaluating ASD. More people aren’t autistic, more people are being diagnosed and receiving counseling for coping with the neurldivergence in a cold and uncaring neurotypical world.
threaded - newest
The source is “I made it the fuck up!”
Also ignoring improvements in diagnostics.
.
I mean, it says the source right there, it’s the CDC…
The organization run by a brain worm driving a human suit?
I don’t understand why you or the person I’m replying to are for some reason seeming to dispute the higher rate of autism diagnosis? It’s a fairly well-established fact, the point of contention is why the rate is higher.
Because that’snot what the graph claims, and it is definitely not what the graph implies.
The graph says that there has been a 400% increase in the prevalence of autism. That’s not true, and is unsupported by the evidence. There has been a marked increase in the effective diagnosis and therapeutic interventions, but autism was largely undiagnosed and under-reported for almost all of human history. We’re still improving and refining the diagnostic criteria, and any changes in the number of cases should not be suggested to support any causal relationship with anything.
The graph is a lie, intended to push a political narrative that undermines the credibility of actual science, all in a transparent effort to distract from powerful child rapists raping children.
The rate is higher because we can “catch” more cases with better diagnosis.
Imagine machine that is throwing 100 balls per second. Another machine that can catch 10 balls per second. You catch 10 balls.
Now newer machine can catch 20, and newer can catch 50.
Does that mean the number of thrown balls is higher? No. It just means we have machines better at caching them. The same goes for any illness, autism, schizophrenia, cancer, depression…
Some ilnesses we are better at curing, does that mean the the illness is getting weaker?
I’m aware of that. I guess my point was that the data isn’t inaccurate, but I suppose* labelling it as “prevalence” is the point of contention.
I guess it could be more accurately labeled as “observed prevalence”, which is distinct from the actual prevalence
<img alt="" src="https://mander.xyz/pictrs/image/b81494cd-4ae8-4e71-9e88-46931a34d9bb.jpeg">
Yes, which happened to be the body that made it the fuck up.
www.abs.gov.au/articles/autism-australia-2022
Yeah, after deleting any data the CDC used to have that they didn’t agree with. And making up any new data they need to make their preconceived notion as perceivably supported as possible.
In this case no. It’s the fact that we’re better at diagnosing things, any disease that doesn’t have active treatments is going to be similar.
You could do reports of ED over time and that graph is going to skyrocket not because it’s more or less common but rather more people are willing to get diagnosed to seek remediation. Right around the discovery of Viagra and it’s ilk you’d see skyrocketing ED diagnoses and it’s not like dicks just suddenly stopped working.
I just mean listing the source as “the CDC” currently isn’t disproving that it’s made up anymore.
It may be accurate, but not because it is from the CDC anymore.
Thought you meant Eating Disorders til the Viagra comment. Had to reread the whole thing
Also, more kids are just getting diagnosed. Back when I was in school in the 90s, I was very lucky to be in a rich school district that actually taught teachers how to spot signs so they could recommend a screening, which the district would foot the bill for because they had a psychologist on staff. Now, more and more districts have people like that, and more and more teachers are taught how to spot early signs of autism (and more parents are aware of it) that kids who previously might have just been “weird kids” are actually getting diagnosed with autism.
I won’t deny a potential environmental link, but if there is one, it’s likely more linked to fossil fuels than anything. BUT that’s hard to get traction against, and it doesn’t have a magic bullet that’ll immediately “solve” the issue.
Can somebody smarter than me tell me what this is trying to say? There’s a bar for surveillance year and birth year. But, for instance, 2012 is on the graph twice with different values. What does it mean?
Edit:
I think I got it. The graph is of “Autism rates in 8 year olds over time”. And the X axis should just be year (in 2 year increments).
It’s no longer number go up good season.
2012 appears once as a birth year and once as a surveillance year. The graph says that they only ever surveyed 8-year-olds, since the birth year is always 8 less than the surveillance year.
But they have 12 bars and 6 labels… it makes no sense
I see 6 labels.
I guess that means 2 surveys per year. But I’m just guessing.Your right I can’t count i guess still makes no sense
It’s probably a dataset that collected every 2 years, but only labeled every other bar to prevent the graph from being overcrowded.
Not a great decision, but not terrible.
Although, I’m a bit concerned for Lemmys graph comprehension skills.
They were told to make a graph that increases and that’s what they did.
Bad graph, they couldn’t decide if the X axis was the birth year of the kids or the year of the test but they give the same information since it’s always 8-year-old kids being tested. Anyways, they wrote the year of the test first and second the year of birth.
… did they adjust the data points to go from lowest to highest
…so the chart go up?
…
*I wrote down the data on a napkin and it makes more sense. These fuckers made a Bad Graph.
I guess we found the answer to “Is math invented or discovered?”
Bad Graph says: 0.75% of 8 year olds were diagnosed in 2000 versus 3.2% in 2020.
Correlation =/= causation.
How have the diagnostic criteria changed in 20 years? Autism was a stigma when I was in high school in 2000, now it’s a spectrum. Are there routine screenings at pediatricians now?
Number go up, but what else go up simultaneously?
I hate it here.
I tutored a young autistic man in college and he was almost non-verbal. He could communicate through speech, but only in monosyllables and with great difficulty and stuttering. That was the only definition of autism I understood at that time, and he was considered better off than many.
A few years later when I learned about Asperger’s because my sister got diagnosed with it, I went to get evaluated myself and after sitting down with me once, they said I’m not autistic.
I’m about 99% sure I would be placed on the autism spectrum today.
I don’t know whether it’s good or bad that the diagnostics / definition of autism seem to be broadening — that’s above my pay grade. But you can’t deny people who weren’t considered autistic 30 years ago are today, and so to compare autism rates which measure clearly different levels of capability is pretty useless.
In order to compare rates, we would need a consistent set of diagnostic criteria.
Same guys that tarrifed an island full of penguins?
Massaging your stats to make them say what you want is basic statistics 101.
Each bar shows two years; years they surveyed the kids and the year the kids were born.
So 2000|1992, is saying that kids born in 1992 were surveyed in 2000. If you look at tmit with thtmat perspective you can see it’s ordered by the year.
Number of unvaxxed kids also growing in the past 22 years. I think it proves that autism is caused by lack of vaccine.
Absolute nonsense graph. Buckle up, this shit is going to get way worse.
r/DataIsBlursed
Now show the testing rate over the same time period!
Anti-vaxxers: No.
There is an 𝑥 axis and it’s not too hard to comprehend, although I’d prefer the dividing character to be newline rather than “|”, or only show the surveillance year.
Also, the “trendline” is sus, an actual trendline cannot always be above data.
The years are either out of order or overlapping.
No, it’s “surveillance year | birth year” and only every other value is listed. It would be nicer with a numerical value but it’s fine.
Well, that's certainly intuitive.
But they aren’t from what I can see. They’re surveillance/birth year pairs in ascending order.
I honestly don’t know why they even list the birth year. It explicitly states “8 Year Olds”, we can do the math.
Yeah Autism rates are going up in all groups because people are getting diagnoses. This is partly about better awareness but also partly about money - there is an incentive to expand the diagnosis, diagnose more people and treat more people, which somewhat muddies the water. Autistic Spectrum Disorder first appeared in the American DSM in 2012, unifying 5 existing conditions into one, and then it moved into the international ICD in 2018 (going live in 2022). It is no wonder awareness has gone up, and infrastructure for diagnosis has rolled out.
We’re not seeing an increase in Autism, we’re seeing an increase in the diagnosis of autism. This graph just shows how stupid and dumbed down the CDC and the White House is under this cretinous president.
It’s probably more than just better diagnosis.
“Advanced Parental Age” has a significant body of work behind it, and people are having kids quite a bit older than they used to, because… you know… gestures broadly at how fucked up the world is
My daughter’s autistic and we were 39 (wife) and 42 (me) when we had her. OTOH, we were two years older and my son isn’t autistic.
Statistical distributions suck, especially when we want a clear-cut cause-and-effect silver bullet. My only sister has two autistic sons, and my wife and I were 7 years older than she was when we had our son and he isn’t autistic (as far as we can tell thus far).
As a brother and uncle, I have incredible empathy for the desire and frustration to just get a clear answer on this. And I recognize these feeling however intense are orders of magnitude less than for a parent. It’s not like lead or asbestos or thaledimide or radiation.
Best we’ve got is a confluence of factors, not the least being family history knowing full well how bad diagnosis has been historically.
It’s so incredibly predatory to dump the science in the trash and just say “it was Tylenol all along”.
Absolutely.
Not sure about that. It can be both.
Sure, it’s possible, but I’m not sure there’s data to support the idea of increasing rates of autism. The increase in diagnosis rates is way too strong of a confounder
Just as the microplastics are getting into everything!
A nice dose of synthetic hormones!
Military spending also increased from 2000-2022, ergo military spending causes autism.
I think the x axis is “year of measurement | year of birth” since they are 8 years apart. Very unconventional and it would need an explanation but it’s not bad to have both pieces of information handy in this context
HMMMMM
<img alt="" src="https://slrpnk.net/pictrs/image/177b489a-dcb2-40be-8a5e-296a70c17f5a.png">
Most magats are autists but not all autists are magats?
It’s hard to speculate, but the cdc should take a look at this strong correlation!!
.
.
When people say autism they think of the nonverbal kind not the model train kind.
I believe the data through 2016, but the last 3 bars are faked. The increase per bin is 5 higher than the previous.
It might be because DSM-V was released in 2013.
Lies, damn lies, and statistics.
Before you get more downvotes, it’s a reference folks: …wikipedia.org/…/Lies,_damned_lies,_and_statistic…
In hypernormalization, making SURE you know they ARE LYING and that IT DOESN’T MATTER is essential.
Because the goal is to make you believe you can’t do anything, so that you give up and demobilize that is their goal.
Very well said. I will make a concerted effort to inject “hypernormalization” into my speech more often going forward. For decades I’ve been saying to friends that the reductionist obsession with “normal” (whatever the hell that means) is a cancer to modern society.
In particular it already sounds creepy when you replace usage with its verb-form, e.g. changing “all my friends are normal” to “all my friends have been normalized”. It’s common practise to use a re-encoder to normalize a “background” playlist of songs to the same dB threshold so no single song sticks out and distracts us from what we are trying to focus on while listening. Similarly, authorities of an authoritarian ilk try to normalize populations so none of them stick out and distract from the primary focus (centralization of power and money). Hypernormalization involves taking that to its logical conclusion, telling the vast majority of people “stay in your lane” - meaning “shut up and consume, and when we tell you what to buy you buy it”, AKA be “normal(ized)”).
The authorities want an homogeneous population, as they also have a limited ability to imagine the social sphere in multiple dimensions, this is why you’re seeing things like the gender binaries. At least that’s just two simulations to run. But gender as spectrum, this becomes quickly untenable for the elites to model for control, they wish the squash the real world complexity into flattened binaries or even uniformity.
Yes, I think you got it exactly right and the audio normalization analogy is correct, at least for sound nerds like us.
Hypernormalization is a dysfunctional response from elites due to their human cognitive weakness. This is why we’re not going back to “King” no single human can bear the complexity of the entire world in their skull mush. They will melt down and genocide the Kurds when it gets too hard for them to conjugate everything. This is why dictators and fascism will do a lot of damage, but have no hope whatsoever for success. They are “rebellion from cognitive weakness”, they violently lash out at complexity itself, at those things they cannot understand. They want to reduce everything to a simple narrative of us versus them and then destroy “them” so only a uniform homogeneous “us” remains. This “us” identical to the ruler, does not require the ruler to imagine “the other” instead they only rule as if everyone else was an identical copy of them. And if anyone disagrees with that, they are “other”.
From that we know the “few” cannot rule the many, but then how do we avoid the traps of design by committee, bikeshedding and the various paralysis that come from complexity beyond human cognition. Concentrations of power are too dumb to rule, but the mob and the market are also dumb and easily fooled, not to mention irresponsible and self-destructive. (The market is burning the planet, right now, it cannot see into the future). The mob is emotional and easily manipulated, often by its own emotions.
I think we need new modes of thinking more advanced than what we had in the 1700s. Something invented with at least the idea of what a computer could do.
You’ll probably want to watch the best documentary on the subject
<img alt="" src="https://lemmy.ml/pictrs/image/71c32564-bd25-4219-95ba-d60bdafcea6a.png">
www.youtube.com/watch?v=Gr7T07WfIhM
I also recommend the following by the same author
www.youtube.com/watch?v=eJ3RzGoQC4s
about advertising and consumerism
www.youtube.com/watch?v=I6EBpLfLHCA&list=PLC4E798…
about how our own surplus value is used against us
Also remember that we only had diagnostic tools for adult autism beginning in the 1980s.
The rise of autism diagnosis does not necessarily equal a rise in autism.
That’s definitely something an autist would say!!! We found them, boys!!!
Please tell me this is fake
That’s like saying we have more cancer now than in the past.
Sure, that might be true in certain scenarios (we’re very good at creating new ways to give ourselves cancer).
The truth is that we’re living longer, increasing the risk and likelihood of cancer, and we’ve gotten a LOT better at finding and diagnosing cancer and specific types.
“8 year olds, dude.” - Walter Sobchak
You said it, maing.
Population size has also experienced dramatic growth… ffs.
Not trying to defend this drivel, but the metric is clearly normalized “per 1000 births”
Ah, thanks I missed that.
That actually doesn’t matter. The stats are per Capita.
In my country there has been a huge increase in both ADHD and autism diagnoses the last decades. At the same time in those years the methods to discover both diagnoses have improved greatly.
But you know, correlation does not equal causation..
30 years ago my teacher suspected i am on som sort of spectrum and had to get tested. I remember going to some doctor and i had to clap really fast and look into a light. Believe it of not i was not diagnosed with ADHD, because i’m a really good clapper
Damn! You should get vaccinated for whatever and try again. Better luck next time?
Yeah, this is like saying “skin cancer rates have increased dramatically in the past 30 years!” Well yeah, because now we have the technology to detect it earlier. That “things increased” stat ignores the complementary “but deaths decreased dramatically” stat that immediately follows it. Before, we didn’t know people had skin cancer until it was killing them. But now, with preventative screenings, public awareness campaigns, etc, people are more likely to get checked before it is a life threatening issue.
It’s the same thing. Detection models got better, so detection rates went up.
Mandating helmets for the boys at the front is resulting in many more head injuries!
prevalence of cancer has increased ∞% since 0 BC
Oh god!
This graph will live forever, in intro classes, as an example of how not to do things.
Im confused, it’s got both axis labeled and seems pretty easy to read.
Maybe points off for having the labels on the outside rim of the graphic.
Doesn’t change the fact that classification of autism also changed over those years, but the graph itself is okay.
What? The line of best fit doesn’t even touch the data.
I’m not saying the graph is the best graph ever, I’m saying it’s far from the worst I’ve seen.
Its also clearly not a line of best fit, as it isn’t trying to “fit” the data. It’s a trend line that’s a vertically offset line from lowest to highest. It’s a stupid line, but being used to convey how much growth their has been.
The only real issue with this graph is the information/context being ommited. We know there is a lot more to the autism debate beyond just the rate of diagnosis.
It looks nepotism put a failson in charge of this graph.
Can anyone decipher the graph for me?
When they collected the data in 2000, about seven 8 year olds out of 1000 had autism. Those children were born in 1992.
When they collected the data in 2002, about six 8 year olds out of 1000 had autism. Those children were born in 1994. This information was not labelled on the x axis.
When they collected the data in 2004, about eight 8 year olds out of 1000 had autism. Those children were born in 1996.
When they collected the data in 2006, about nine 8 year olds out of 1000 had autism. Those children were born in 1998. This information was not labelled on the x axis.
When they collected the data in 2008, about eleven 8 year olds out of 1000 had autism. Those children were born in 2000.
… I’m too lazy to continue but …
When they collected the data in 2020, about twenty seven 8 year olds out of 1000 had autism. Those children were born in 2012.
When they collected the data in 2022, about thirty two 8 year olds out of 1000 had autism. Those children were born in 2014. This information was not labelled on the x axis.
I’m not positive i’m reading it right, but that’s what I think they were trying to convey with this (terribly labeled) graph.
eta: yeah, rereading the subtitle, those numbers and years make sense
Any clue why there are 2 bars per year grouping?
I thought it was maybe number of cases in each year, but 2000 at the beginning of the graph and when 2000 appears later don’t match.
I think there’s actually not 2 bars per year, but instead:
The x axis increases by 2 years each entry.
The number after the “|” is only meant to “helpfully” (and confusingly) tell you when those children were born. To take your example:
That makes sense now! Thank you, I was having trouble wrapping my head around it!
The line went up which usually good. The very best. We have the best lines in this great country. But Bobby said this isn’t a good line so I said, I told them, we need to find out why the line is bad. And I’ve got people on it who say don’t take Tylenol. So that’s all that needs to be said. Don’t. Take. Tylenol.
you know, everest was still there before it was discovered.
Everest wasn’t murdered before it was 5 years old.
taps the chart
<img alt="" src="https://l.twipped.social/pictrs/image/1e88d646-0582-4905-9059-81d597b2816b.png">
If they could read or do comparisonal analysis or could formulate higher-functional abstraction in their frontal lobes, this would really make them think.
They’re basically banking on people still thinking, autism is “intellectual disability, but quirkier and more difficult”, while I have met “more severe” cases who did not had the ID part, they just were lucky to avoid the diagnosis for long, and thus people didn’t pretend they’re “too dumb to even learn to count to 10”.
I’m a woman in my 40s who is probably autistic, but back then I was the wrong demographic and “too well behaved” to even consider diagnosis. I’m a typical example people think of when thinking about under diagnosis.
On the other hand, I work with people who have severe learning disabilities who also evaded diagnosis, or were diagnosed well into adulthood as diagnosis is difficult in someone so impaired. In another time, they would have been labelled with a grossly offensive term and just left. Better treatment of disabled people is probably another reason we see rising rates of diagnosis.
Our species broadly doesn’t think in terms of spectrums or nuance.
I burned years of my life trying to make arguments from reason and explain how there can be simultaneous truths or that issues are not black-and-white. It has NEVER stuck, not with friends, not with family, not with strangers on the internet.
People’s minds largely do not work that way. We all HAVE to digest this and mourn it and let it pass through us so we can stop trying to argue with these blockheads in ways they can’t even grasp. We can change them if we tell them stories about feelings, if we make them feel validated or heard, we can change them with careful, patient one-on-one care like a parent telling a child bedtime stories… but this takes a level of energy, empathy and patience that few of us have. Some do, I give massive respect to those who have dedicated their lives to this kind of outreach. I wish we had more.
This is precisely what ‘leader scientists’ did when folks in power plopped them before crowds and radio and TV and such for a long time.
…It kinda worked.
But we’re in the algorithmic attention era now. We are past that era.
10 out of a 1000 to 30ish out of a 1000 doesn’t even seem like a massive increase, especially if it’s really due to something like a pain medication that is taken by a huge population. Which it’s not as it’s more related to improvements in diagnosing.
I guess they are just hoping people see bar go up and therefore bad.
What’s wrong with the x-Axis?
Main problem is that its not really an axis at all.
Maybe what’s important is the axis we made along the way
if you look at it for 1s it looks scary (if you’re afraid of autism ig). if you look at it for 2s it doesn’t make any fucking sense like, at all
I think it’s birth cohorts
I think it’s just the number of diagnoses made in that particular year. But it doesn’t matter because we know this graph is made up anyway. It’s a Trump administration putting it out, I bet not one of them knows how to get excel to output a bar chart, so instead it’s just random rectangles they’ve drawn.
I mean there is scientifically a rise in autism diagnoses, but it’s like explained by awareness and decreased criteria to qualify as being on the spectrum - not by an increase in actual autism.
Guarantee you the people afraid of autism has no idea what it even is, other than “bad”
There’s a vast number of conservative parents who have said they would support abortion in cases of fetal abnormalities like “autism” because they’re not pro-life or informed about anything, they’re just scared. They’re scared of hardships, they’re scared of emotional labor, they’re scared of the social stigmas around having to care for someone with special needs, they’re scared they won’t love a child who isn’t normal, and will be judged for it.
It’s not possible to diagnose an autism until the age of about four or five at the earliest so I’m not sure how they’re planning to do that
They don’t think in logical, reasonable systems, they imagine stories. The entire conservative mindset is narratives and feelings. That’s why things like vaccines and tylenol go so hard for them, it’s an easy McGuffin to comprehend and work into their mental storylines.
The axis makes sense with the label, they just didn’t label every data point.
Not autism rates, detection rates is what’s up, more kids are growing up with adequate helps and therapies so they can grow to be functional adults.
It is the same story as gay infecting children’s minds.
They are selling awareness as something to be afraid of. Which is yet another layer od evil.
Not only that, but they wish really hard for us to be their tiny little scapegoats, when probably most of the autistic community hates them.
Adequate helps and terapies - repression and psychological abuse. Great. We are functional adults, fuck you.
Uuuhhhhhh, I’m an autistic adult who can somehow function because I had heaps of help growing up, many of my friends weren’t that lucky and have a hard time just existing.
Fair point, sorry. My statement about not torturing children still stands.
Not all therapies are ABA, most are based in science and helps the kid instead of scarring him, when i was little I actually looked forward to some of them like neurofeedback.
Also: Airbus A320 Neo.
Too add to that there are more types of autism. It’s a spectrum.
Yes, trains autism, boats autism, Math autism… /j
No but for real, no two autistic individuals are ever the same.
Diagnosis has improved and perhaps been used too soon in some cases. Its always been here but environmental changes of some kind have increased it slightly. Most likely medical culprit is NSAIDs. Not trumps scapegoat of the moment. The other brand was however shown to cause people to lose empathy with sustained use in some studies.
Autism diagnosis rates. Quite a difference.
Well, get out of here with your logic and reason…
Remember Covid, don’t report on things = they stop existing.
Will this administration release data on the impact of fossil emissions on diseases like asthma?
.
Also heath waves death tolls
<img alt="" src="https://sh.itjust.works/pictrs/image/c5f2b4a8-477d-4ef6-95e3-b54b67225b04.webp">
It’s been a mess out there, for sure.
Oh, they will. But reliable data?
Be careful what you wish for, lol.
In other news, visibility bias has been classified as communist propaganda. Anyone who says this isn’t representative of an actual increase in the incidence rate is a communist and can safely be ignored.
Dude…
For some reason, that doesn’t look like a GPT-generated graph, which means… sadly… that someone had to make that thing… and somebody had to approve it.
What do you bet it’s not even based on real data and it’s just some random rectangles that they drew.
They also could have just grabbed any graph off of google images and relabeled it. That was a apparently a popular shortcut in corporations when someone had to present to their bosses.
OK there are not 2 bars per year. 2nd last is 2020, last 2022.
It’s not clear why everyone is mad at the chart. It does show an increase. Though, this is about autism diagnoseses, which can be influenced by kickback bribes for diagnoseses.
There is a sharper (exponential) increase since 2012, even though pharma corruption solutions existed many years before then, afaik. Some explanation for the acceleration is needed. Its not tylenol or any new vaccines.
My diagnosis is in that spike. I got diagnosed late because it took that long to get away from my autism denying parent and enough time living on my own to start wondering about my “weird habits”, especially after starting to meet others “like me”.
It stopped being a disability in my mind and started being more like a superpower, and eventually out was just who I was and y’all can just deal with it. Of course I leaned boundaries and social graces because we live in a society, but how I view myself and other people definitely changed
So I think it has a lot to do with how this generation and previous ones changed how they handle autism.
Autism diagnosis is can also be increased by just better recognition of the disease. You think anyone was going around giving out autism diagnosis in the 90s come on.
An increase in diagnosis rates does not indicate an underlying increase in the condition.
Er, did you look at all the dates on the x axis? Because that shit makes no sense whatsoever.
Er, did you look at all the dates on the x axis? Because that shit makes no sense whatsoever.
It took me a while to understand the graph too. All of the information needed is included in OP image. Posting what may be Trump/RFK propaganda that may or not be based on lies and non data, just to attack it for not being the absolute clearest graph is posting Trump propaganda. Graph would be clearer if they omitted birth years. OK.
Posting this is still equivalent to “sun goes up sun goes down. ain’t nobody understand that” manipulation that reinforces people’s lack of understanding to trust the speaker on anything and everything.
I wouldn’t be surprised if diagnosis increased as public awareness increased.
Who’s gonna make all the technology, music, art, etc, after we’ve finally cured autism? We might have to start re-autisming people.
That line of best fit doesn’t even match the data. How can it start above the data and then finish above the data but still be line of best fit. Not that that’s the only problem with this graph of course.
Sorry, it’s actually a “best fits our narrative” line. I can see how you might have been confused.
I think it’s just a trendline, not a line of best fit.
Cool but
<img alt="" src="https://lemmy.world/pictrs/image/72ab4280-bddb-4346-bb85-c2cd42358306.jpeg">
Original: x.com/WhiteHouse/status/1970231219255468377
Well the cure is clearly to stop testing.
Instances of autism have skyrocketed since the discovery of autism and effective testing for it.
Clearly these tests are causing the autism. It’s a conspiracy by Big Autist to make the world a quieter and more curious place. The railway companies are in on it too.
I think you just predicted the next South Park plot.
Synopsis:
Robert F. Kennedy Jr. reveals that Tylenol causes autism, he then wants to open a bottle of it, but fails miserably. Then Eric Cartman gets on the stage talking about the evils of autism, then he shows he was bitten by an autistic girl he “played with”, but the security footage he shows about the meltdown reveals he terribly bullied her, so people will immediately feel sorry for the girl instead.
Kyle manages to open a bottle of Tylenol, not knowing it summons cenobite-like autists from a different dimension, supposedly turning the people who summon them into autists. The others, save for Cartman, manage to find the same autistic girl bullied by Cartman who can also open that bottle summoning the other-worldly autists, who then be convinced by the boys to take them to the autism-world. Said autism-world is mainly designed around the needs of autistic people. After some shenanigans, there comes the reveal that Kyle was always autistic, the autism-cenobites don’t turn anyone into autists as Tylenol bottles can only be opened by other autists, he just was very good at masking, wants to go back to his own world even if there would be people who will bully him for what he is.
Meanwhile, Cartman goes on an “Autism Awareness Tour” to “promote remedies”, but tanks them the moment he shows the footage.
Autism tests cause autism, got it, let’s roll boys, we have more science to ban
Assuming the data is true (doubt it because of fucking beef jerky man), it’s not so much that autism is on the rise so much that autism rates are being diagnosed more and autism is less stigmatized than it was previously.
Imagine the sexist fascist racist homophobe convicted Cheeto puff is also ablest, please keep adding adjectives that describe the 47th president of the Confederated States
If I remember correctly, it fits the same overall curve of the number of reported left handed people over time after society stopped forcibly making people use their right hand. Shockingly, actually making an attempt at diagnosing people and tracking those diagnoses makes numbers go up.
maybe that’s why they were elected lol
/s
Didn’t we used to hide it?
Yes. This is an artifact of a destigmatization coupled with better diagnostics for evaluating ASD. More people aren’t autistic, more people are being diagnosed and receiving counseling for coping with the neurldivergence in a cold and uncaring neurotypical world.
That’s the era they want to drag us back into, even if it costs us suicide and/or substance abuse.
I remember when my mum was filling out a form as part of the autism assessment, she was like “sounds a lot like my husband as well… And his dad”
I’m convinced my mom is on the spectrum and my grandparents